February 11, 2026

What Progress in Reducing Hospital Infections Looks Like
The Centers for Disease Control and Prevention (CDC) released its most recent annual progress report on healthcare-associated infections (HAIs) late last month, and it’s clear that any “progress” is in the eye of the beholder.
The report tracks six types of infections acquired by patients reported to the CDC by general acute-care hospitals, critical access hospitals, inpatient rehabilitation facilities and long-term acute care hospitals. The six types of infections are:
- Central line-associated bloodstream infections (CLABSI)
- Catheter-associated urinary tract infections (CAUTI)
- Ventilator-associated events (VAE)
- Hospital-onset methicillin-resistant Staphylococcus aureus (MRSA)
- Hospital-onset Clostridioides difficile (CDI)
- Surgical site infections (SSI)
The CDC then calculates the ratio between observed and expected cases of each type of infection and compares the six ratios with the ratios from the previous year to determine how much progress the four types of settings are making in reducing HAIs.
Well, I, like all patients, live in the observed world, not the expected world. Here’s what progress looks like where I live. The total number of infections of all six types reported by general acute-care hospitals dropped 7.3% to 123,204 in 2024 from 132,913 in 2023. That’s progress if you’re one of the 9,709 fewer people who didn’t contract an infection in the hospital in 2024. That’s not progress if you’re one of the 123,204 people who did.
Here’s what that progress looks like by HAI by reporting hospital by year. This is my math:
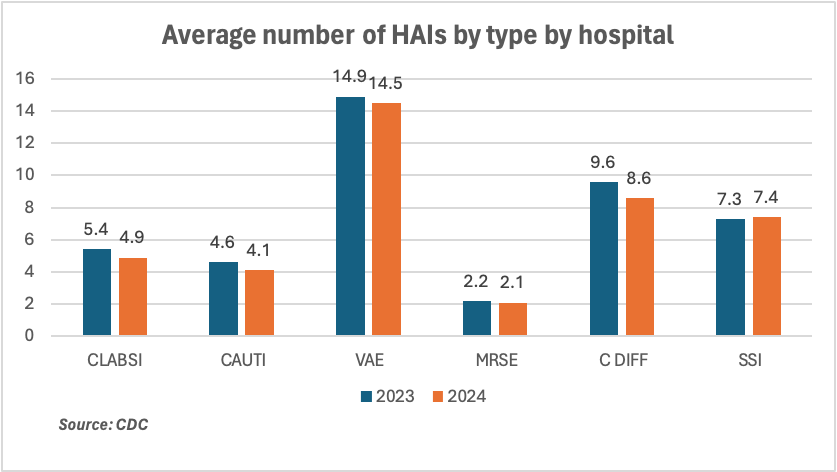
The average number of HAIs reported per hospital dipped for five of the six types of infections. It went up for surgical site infections.
If you want to do your own math, here’s a link to the CDC’s 2023 HAI progress report. Here’s my blog post about the 2023 numbers: When Nearly 125,000 Hospital Infections Is Good News
I look forward to the day when I can write about what real progress in reducing hospital infections looks like. That will make a great chart.
Let’s build better healthcare.
Thanks for reading.

About the Author
Recent Posts